Measuring the true scale of personalisation on VOD
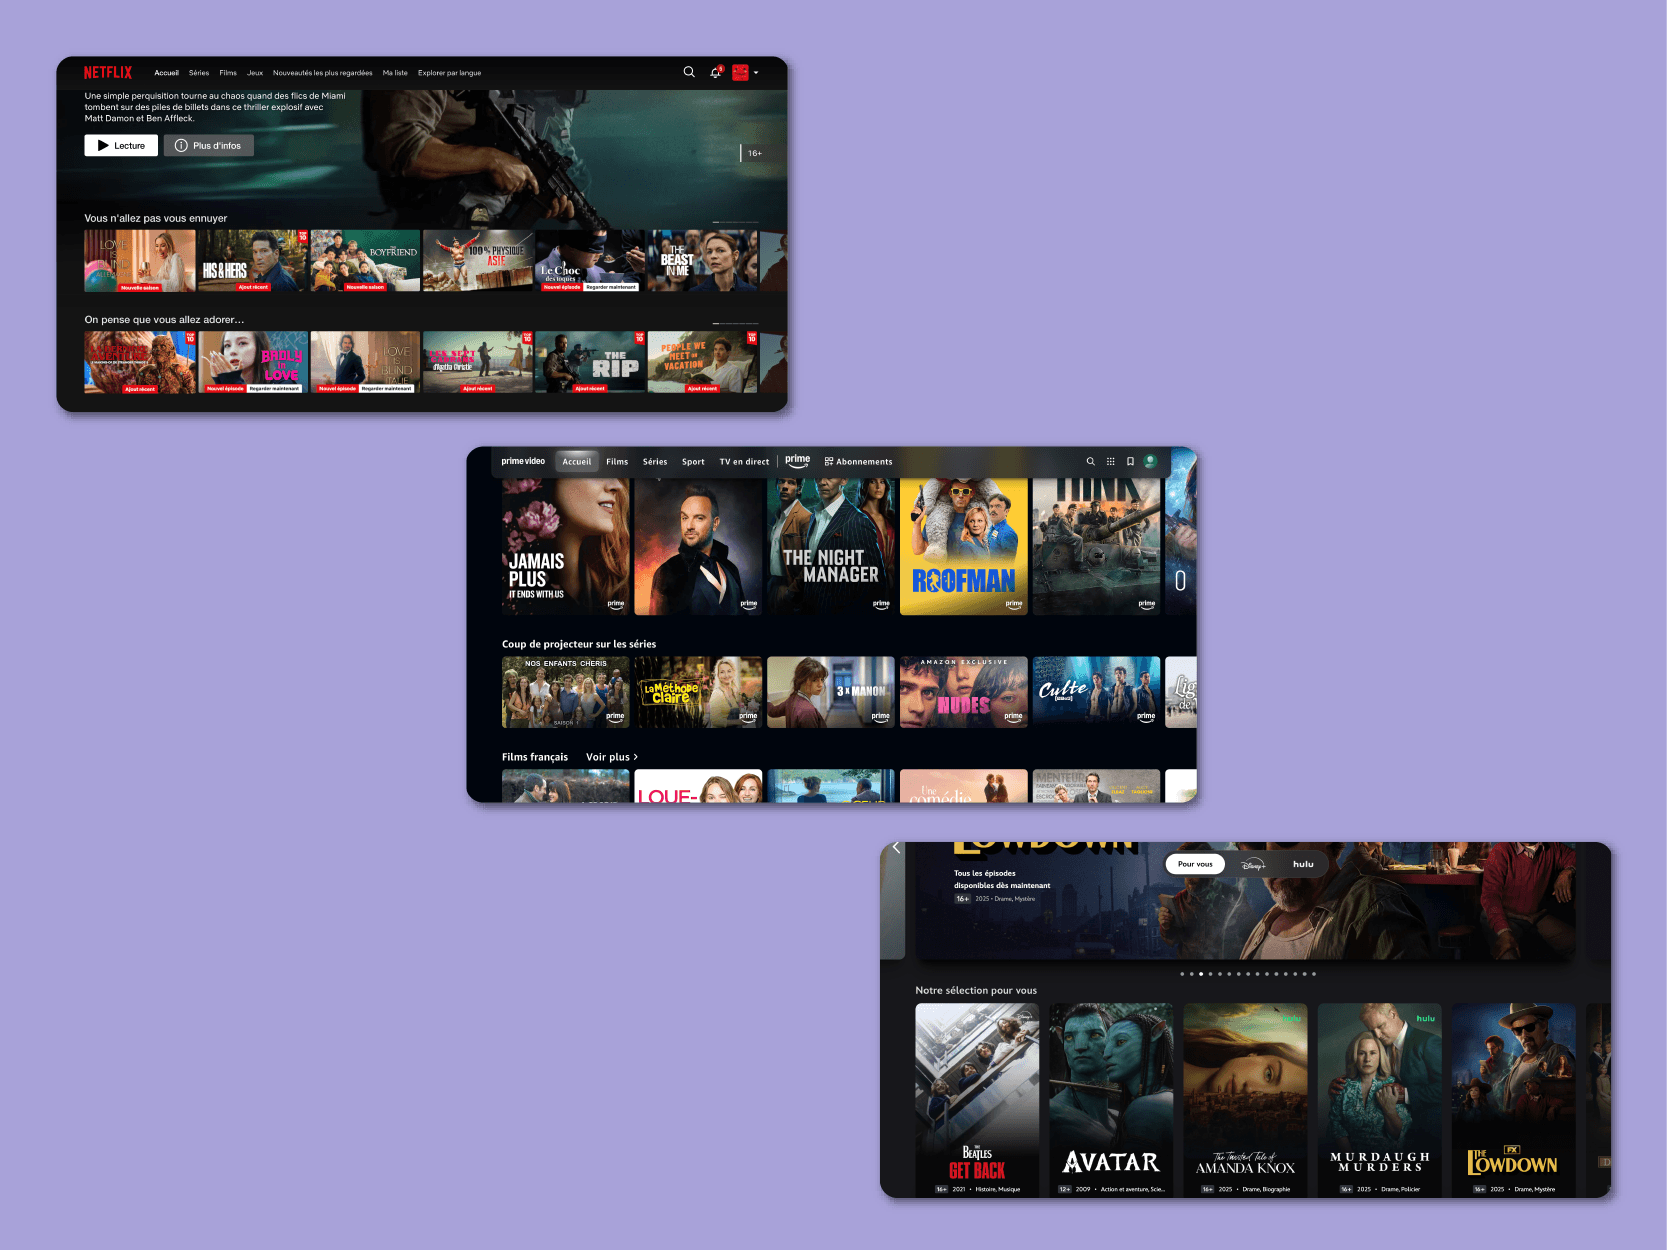
We looked at the homepages of multiple profiles on Netflix, Prime Video and Disney+ to find out just how personalised they really are.
Algorithmic recommender systems have been around for a long time now, and we, as users, have grown accustomed to them guiding us through vast libraries of content. Much has been written about their potential benefits and perceived harms, or about their design and efficiency, but surprisingly little about the actual scope of their implementation and the curatorial power that they hold. This article will focus on the three leading VOD services, Netflix, Prime Video and Disney+. All three have recourse to recommendation algorithms that surface titles based on the user’s viewing behaviour. At this point, we all know the story: prominence, or a high degree of discoverability, is awarded to titles that the algorithm supposedly considers of interest to the user, thereby preventing choice overload, something of a common frustration in our age of digital abundance.
But is the algorithm curating a truly personalised selection of films and series? Or is it nudging us all towards the same titles, regardless of our preferences? More broadly, are recommender systems contributing to the fragmentation of our collective consciousness? Or are they simply less omnipotent than feared?
Industry professionals and the public at large increasingly presume that any time a service relies on algorithmic recommendations, the personalisation is total, such that no two homepages are ever the same. That may be true of social media platforms with millions of users or music streaming apps and their bottomless catalogues, but is it true of VOD services? There are reasons to doubt. First, the relatively limited size of VOD services’ catalogues would make extreme personalisation like Spotify’s pretty inefficient. Secondly, the major VOD services are all producers themselves, having to promote their own titles on top of the licensed content on their platform and, increasingly, content from third-party services. This means that not all titles are equal, and a recommender system cannot be completely blind to its maker’s economic incentives. A third reason to doubt the all-encompassing nature of personalisation on VOD services is the very nature of our demand for films and series, which tends to be wider than for music, even for those with the most peculiar tastes. It would be hard for example to imagine a Netflix user with tastes so niche that the new season of Stranger Things isn’t featured on their homepage.
That being said, personalisation does undoubtedly influence what we get recommended. The question is "to what extent"? To try and answer that question, we’ve devised an experiment, which will help us identify the algorithm’s degree of contribution to the composition of a homepage.
The experiment
We created, from scratch, four profiles on Netflix, four profiles on Prime Video and four profiles on Disney+. We control the activity on all accounts, and each VOD service gets assigned the same four profiles. One profile acts as a control by not watching anything or interacting with the service in any way. This profile can be considered “blank”. The remaining three profiles each watch 2 hours worth of content per service per week. Each profile has its own, somewhat archetypal tastes, reflected in what it chooses to watch on the service:
- Michel watches only "masculine" shows and films, and tends to lean towards action and sports-related content
- Jim is the stereotypical "feminine" profile, opting for romantic comedies and female-led dramas
- Antoine is our "teenager" profile, displaying a strong affinity for anime, superhero content, teen dramas, and everything you’d expect a French teenager to enjoy.
The profiles were created over a year ago, and we have since collected their homepages at weekly intervals (every Friday) on each service.
The results
The homepages of Netflix, Prime Video and Disney+ might all look the same in terms of design — a single title or carousel at the top spanning the full width of the screen, followed by a series of thematic rows that the user can scroll horizontally — but their sizes vary greatly. A full Prime Video homepage on a web browser typically contains more than 25 000 thumbnails (or tiles or whatever you choose to call them) when scrolled all the way to the bottom and all the way to the right on every row. By contrast, a full homepage on Netflix contains no more than 1 500 thumbnails and on Disney+ between 1 200 and 1 600.
Our analysis will focus on the second half of 2025, from July 1st to December 31st. From their creation in January up to the start of July, our profiles had presumably already watched enough content for their homepages to be “fully” personalised. Thus, with enough data over a sufficient period of time, we can now answer with certainty the questions below:
What proportion of a typical homepage shows titles that also appear on the homepages of all other profiles?
On Netflix, 27% of all thumbnails on a user’s homepage typically appear on all other profiles’ homepages, regardless of what the user has watched in the past.1
That number is much higher on Disney+, which has a homepage of comparable size, with 65% of all thumbnails advertising titles that are also suggested to all other profiles.
Prime Video’s homepage is significantly larger than on Netflix or Disney+, so it’s not surprising that it has the highest share of overlap between profiles, with 93% of all thumbnails on a typical homepage being shown to all other profiles. In fact, not only is Prime Video’s homepage larger, but it also includes many rows of content from third parties that Amazon doesn’t necessarily have editorial control of.
However, if we were to consider only the very top of the homepage on all three services, by keeping for example only the thumbnails that appeared within 5000 pixels from the top and 5000 pixels from the left edge of the screen (to allow for some scrolling of the first few rows), we could nullify the effect of a page’s size. Thus, on Netflix, 19% of the thumbnails in this most prominent zone of the page typically appear in the same zone on all other profiles’ homepages, regardless of what the user has watched in the past. That number is 20% on Prime Video and 40% on Disney+. This paints a different picture, with Prime Video having the same degree of overlap between profiles as Netflix, at least when it comes to the top of the page. Disney+ on the other hand has undoubtedly the least personalised homepage among the three VOD services, with 65% of shared thumbnails overall and 40% at the top. Whether that is the result of an editorial choice or simply the consequence of a narrower catalogue is difficult to say.
On Netflix, 27% of all thumbnails on a user’s homepage typically appear on all other profiles’ homepages, regardless of what the user has watched in the past.
It would appear then that Netflix has the most dynamic homepage overall, insofar as it contains the smallest proportion of thumbnails that are recommended to all profiles at once. For brevity’s sake, we’ll concentrate on Netflix for the remainder of this article, but feel free to contact us2 if you’d like to know the details for Prime Video and Disney+.
Which titles tend to appear on all homepages, regardless of the user’s preferences?
If only 27% of thumbnails on a typical Netflix homepage are shown to all users, we can presume that those thumbnails advertise titles of considerable editorial value to Netflix, or at least that they are susceptible of appealing to a wide audience. Let’s look at those titles more closely (they number 1 137 over our 6-month period).
The thumbnails on the homepage that are also shown to other users are made up on average of 60% of series and 40% of films. Unsurprisingly, they tend to skew towards recent releases, but perhaps not as recent as one might expect. In fact, on average only 36% of shared thumbnails advertise titles that have been released in the past 12 months. This can be taken to indicate that, when selecting titles to recommend indiscriminately to all users, Netflix prioritises shows and movies that have a record of appealing to wide audiences, something that new releases may not have had time to prove.
Among the titles that are suggested to all profiles regardless of individual preferences, 60% on average are from the US, while 16% are from France (the Netflix account is French) and 14% are British. This may seem like a huge preference for US content, but in our view it shows on the contrary a high level of confidence in the ability of local content to attract a wide array of audiences, in an otherwise typically much more US-dominated field.
Where do titles that get suggested to all profiles appear on the homepage?
Not all thumbnails are equal. On a homepage, the position of a title determines its discoverability, and simply appearing on the page does not guarantee that the user will scroll to it. Obviously, the closer a thumbnail is to the top of the page and to the start of a row, the more discoverable it is.
Despite having identified that 27% of a typical Netflix homepage is made up of "shared" thumbnails, the placement of those thumbnails may vary greatly. Overall, 25% of shared thumbnails appear within the first five rows of the homepage. This slight propensity to occupy the top of the page can be partly explained by the frequent presence in that zone of the Top 10 lists for films and series, which stay the same for all profiles in the same region. As for the remaining 75% of thumbnails that also get recommended to all other profiles, they tend to be scattered throughout the rest of the page.3 What this means is that the homepages of various profiles don’t just overlap in certain areas, and inversely that personalisation doesn’t just occur at the start, the middle or the end of the page but permeates the whole page.
To what extent do personalised profiles deviate from a blank profile?
In order to truly determine the extent of personalisation of the homepage, we should compare our three personalised profiles with our control, a profile that never watches anything and doesn’t interact with the service. If we consider our "blank" profile’s homepage to be the default, unpersonalised homepage, we can then assume that every thumbnail that gets shown to other profiles but not this one is there as a result of personalisation. Thus, on average, 48% of the thumbnails on the homepage of a personalised profile are there as a result of its past behaviour on the service, meaning that they don’t show up on our blank profile’s homepage at the same time.
48% of the thumbnails on the homepage of a personalised profile are there as a result of its past behaviour on the service.
There is little variation in that respect among our three personalised profiles. The one that tends to resemble the blank profile the most is Antoine’s, our teenager profile, with on average 56% of its thumbnails also appearing on the blank profile’s homepage at the same time. Michel, our "masculine" profile, shares 52% of its homepage with the blank profile and our "feminine" profile Jim is the most idiosyncratic at 47%.
Conclusion
We can confidently say, in light of the above, that algorithmic personalisation does not make all homepages completely unique. In fact, all three VOD services recommend a significant number of titles to all profiles at once, regardless of what they have watched in the past. These titles represent in turn quite a large proportion of a typical user’s homepage. That profiles with completely different tastes get recommended the same titles can only be the result of editorial intent, possibly expressed backstage through curated selections of wide-appeal titles or through the way the algorithms are configured, or a mixture of both.
In any case, being able to pinpoint these "shared" titles helps to uncover trends and patterns in what are otherwise quite opaque content placement strategies on VOD services. Using this methodology and applying a host of other metrics (prime-space, drop-off rate, page dynamism score), we can obtain a true picture of what users actually see on their screens, which has value not only for regulators and public bodies who want to make sure that local content is discoverable, but also for rights holders and increasingly for third-party services whose content is distributed through those platforms.
We’re not the first to point this out, but it looks like the future of "home entertainment" will be even more aggregated than it is today, and algorithm/human-curated portals will play an even more central role than they already do. But instead of making assumptions about that curation, let’s use the means at our disposal to actually observe it.