Tackling streaming’s analytical blind spot: content prominence
Content availability and audience metrics do not tell the whole story.
Imagine knowing a film’s box office receipts but not how wide of a release it got, or a TV program’s audience but not on what channel or at what time it aired. That’s where we are at right now when it comes to video-on-demand analytics. Sure, The Night Agent was a hit. But how prominent was it? And can we really say that Expats was a flop when we don’t know how visible it was on Prime Video's homepage?
Just like a TV program’s audience depends on where and when it is scheduled (network position, primetime slot), a title on a VOD service will succeed only if it is “discoverable”.1 It seems obvious, but a user is more likely to pick a title that is featured on the first row of the homepage than a title on the bottom row.2 Yet discoverability on VOD services has until now remained beyond the scope of analysis in the industry. Rights holders, studios, sales agents and creatives frequently denounce the opacity of VOD services, which causes them to make decisions based on incomplete information. We strongly believe that by introducing visibility as a new metric, we can help all parties get access to the information they need.
Addressing widespread information asymmetry
As a rights holder, licensing to a VOD service is a risky affair. Throughout the industry, VOD rights are being sold “blind”, using woefully inadequate metrics like box-office performance to estimate the on-demand value of titles. The fact is that you know far less about your content’s worth than the buyer:
- They know how similar titles have performed on their service; you don’t. Or maybe you’ve bought vague data from a “panel of consumers” that’s supposed to tell you, through considerable interpolation, what millions of users like to watch.
- They know how much prominence they will give that title; you don’t. You also don’t know how prominent similar titles are or have been on that service.
Not to say that all rights holders are getting ripped off, but information asymmetry certainly doesn’t help. In fact, one of the conclusions of the Berlinale EFM's 2024 Think Tank was this: "The lack of data transparency puts producers at a disadvantage during negotiations, reinforcing their lack of bargaining power."3

We provide data that helps rights holders (studios, producers, distributors, sales agents) negotiate deals on equal terms with VOD services. Access to the right information allows them to better estimate the value of their content and, crucially, stops them from selling themselves short. Over the past few years, we have seen multiple instances of films being sold cheap to a streamer because of poor box office performance, only for those films to be given massive prominence on that service and enter the Top 10 most viewed titles of the week.
It is not uncommon, when selling theatrical or TV rights, to demand a minimum marketing spend on the part of the buyer, or a minimum number of copies on which the film should screen. Perhaps the time has come to apply the same logic to VOD by demanding a minimum level of visibility on the interface.
Prominence as a measure of success
Visibility is a potent indicator of performance. Streaming has taught us that measuring performance in a non-linear context isn’t quite as straightforward as it used to be in the linear world. Netflix can dump six months of viewership data and there is very little that we learn from it. Measurement firms (Nielsen, Barb, Médiamétrie and others) have to contend with panels and extrapolation leading to inaccuracy. Then there is that whole “what counts as a view” debate…
And even when we do know viewership, it seldom tells the whole story. For example, do low audience numbers point to a lack of attractiveness or a lack of visibility? Is a sharp increase in a title’s viewership the result of extraneous factors or is it due to improved visibility on the interface?
The right approach would be to combine different metrics. By complementing viewership with visibility and availability data, we obtain a more detailed picture of a title’s performance on VOD.
Visibility data can help analysts break free of what Amanda Lotz calls the "hegemony of linear norms"4 like scheduling, prime time, audience measurement... These norms, which are often awkwardly transposed to the on-demand ecosystem, can only offer a partial understanding of the actual mechanisms at play. Only by making use of a VOD-specific analytical tool set can industry professionals better understand content strategies in a non-linear context. Measuring content prominence on a user interface may be a new approach, but it is long overdue.
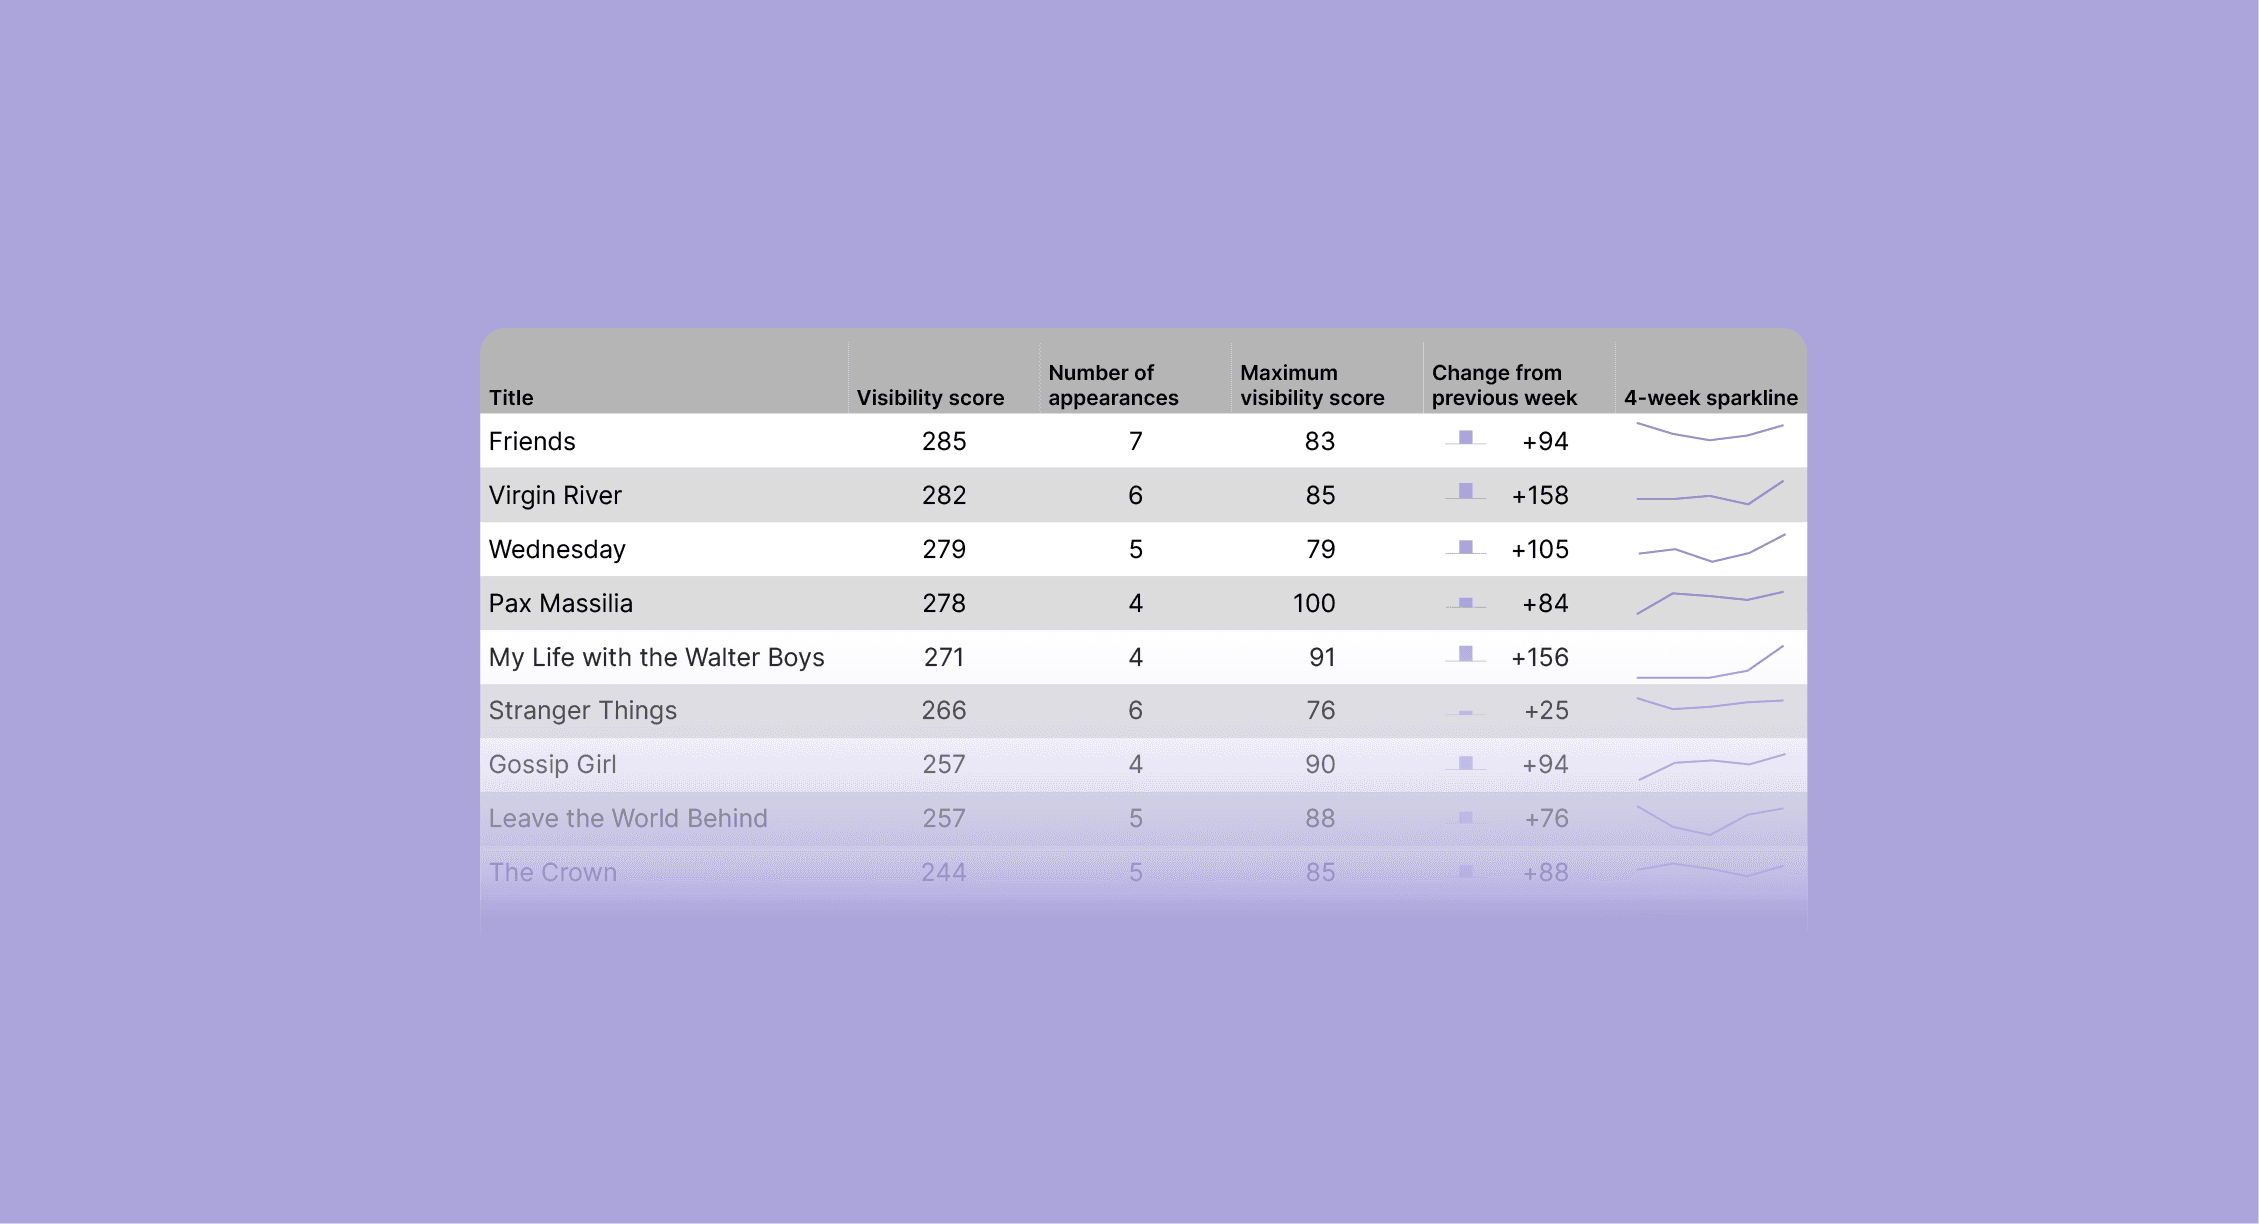
When applied on a per-title basis, visibility metrics allow us to establish rankings of the most visible titles on a service at any given time, which often have only little overlap with the Top 10 charts on those services. Our visibility score5 also makes it possible to look at the overall visibility of any variable, such as genres, nationalities, languages, even actors and directors. Here are some of the questions that we can answer:
- What genre of content (reality TV, animation, documentaries...) is most visible on the homepage?
- How prominent is local content compared to international productions?
- What are the most prominent actors/directors on the service and how does their visibility evolve over time?
Taking algorithmic personalisation into account
But what of algorithmic personalisation, you might ask. Isn’t each profile unique, based on past behaviour? Well, that’s where looking at prominence gets even more critical.
The most popular VOD services satisfy niches, and personalisation implies that the more a user veers toward a certain niche, the less other niches will be visible on the interface. This is what viewership data fails to take into consideration. As it stands, measuring viewership on VOD is a bit like measuring broadcasters’ audience shares, only each viewer is in a totally different market.
At any given time, my Netflix homepage, with all its rows and thumbnails, is showing me about 800 unique titles out of a library of 5000. But these 800 titles are curated according to my past behaviour, and my next door neighbour probably has 800 completely different titles on their homepage. For example, the fact that my neighbour has watched the latest season of Selling Sunset and I haven't isn't necessarily due to the show's appeal or lack thereof. It may simply be that it was never suggested to me in the first place.

Our methodology allows us to overcome the limitations of viewership data. By looking at content prominence on the homepages of users who have expressed interest in specific genres, languages or formats, we can start to unravel the process through which a user comes to watch certain shows or films over others. Analytics in streaming have tended to focus on the demand side of the market, but it is really by looking at the interplay between supply (content prominence) and demand (viewership) that one can arrive at an understanding of the VOD ecosystem.
Here are a few examples of the kind of questions we provide answers to:
- Are K-drama fans being suggested documentaries?
- What titles are prominent no matter what the user has watched in the past?
- Is auteur fare only being shown to users who have previously watched indie movies?
- Are WWII documentaries more prominent when the user has watched Saving Private Ryan?
Conclusion
Analytics in the VOD industry have to keep up with the times. Library data (what's available on Netflix, Prime Video and others at a given moment) is essential. But it is also very basic information that, all things considered, doesn't tell us a great deal about those services' content strategies.
Many professionals still approach the on-demand ecosystem with a mindset inherited from the world of cinema and TV. The shift from linear to non-linear consumption of audiovisual content has mostly been interpreted as an evolution within an established industry, and analytical tools have stayed unchanged. But what we should be doing is deploying new tools to reflect changing practices in the industry and keep up to date with the new ways that audiences discover content.
Visibility data is the missing piece of the puzzle when it comes to understanding how supply and demand interact in an on-demand world. Content is no longer broadcast or scheduled, it is suggested in a thumbnail, and where that thumbnail appears on the user's screen is of the utmost importance. This is where the core of the industry now lies, and it is also where we should focus our analytical gaze.
Notes
- ↑
The notion of discoverability first appeared in Canada in 2016, amid a rising fear that French-language titles were not prominent enough on VOD services.
- ↑
Case in point: when’s the last time you decided to watch something that wasn’t suggested to you on the homepage?
- ↑
Surfing the Waves with a Growth Mindset: EFM Think Tank Report 2024 - Link
- ↑
Amanda Lotz (2022), Netflix and Streaming Video: The Business of Subscriber-Funded Video on Demand. Polity Press, Cambridge
- ↑
To learn more about our visibility score, click here.